Statistics Table Editor
Statistics Table Editor
Statistics Table Editor authors a statistic's value at every rank. It is the same editor everywhere it appears — Characters, Classes, Enemies, Equipment, and Skills all use it.
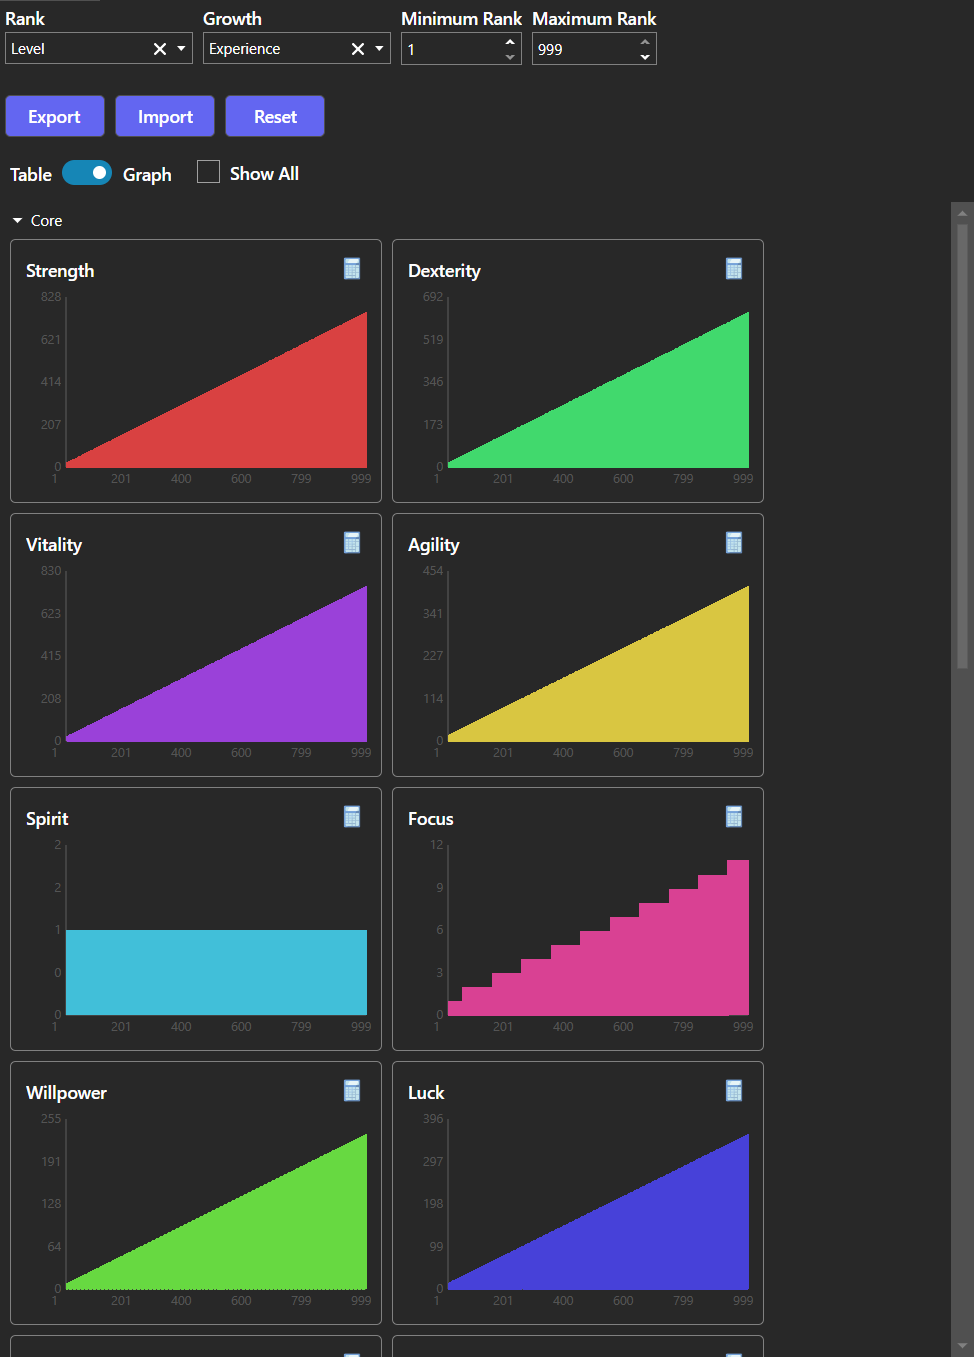
The editor works in two formats, switched with the Table / Graph toggle. Table lists one row per rank and is where the values are edited directly. Graph plots the same values as a curve, which is the faster way to judge whether growth accelerates or flattens at the intended ranks.
Rank and Growth choose which statistic drives progression and which one measures it, and Minimum and Maximum Rank set how far the table extends. Export, Import, and Reset act on the whole table at once.
The values the table holds are documented under Statistics Table.
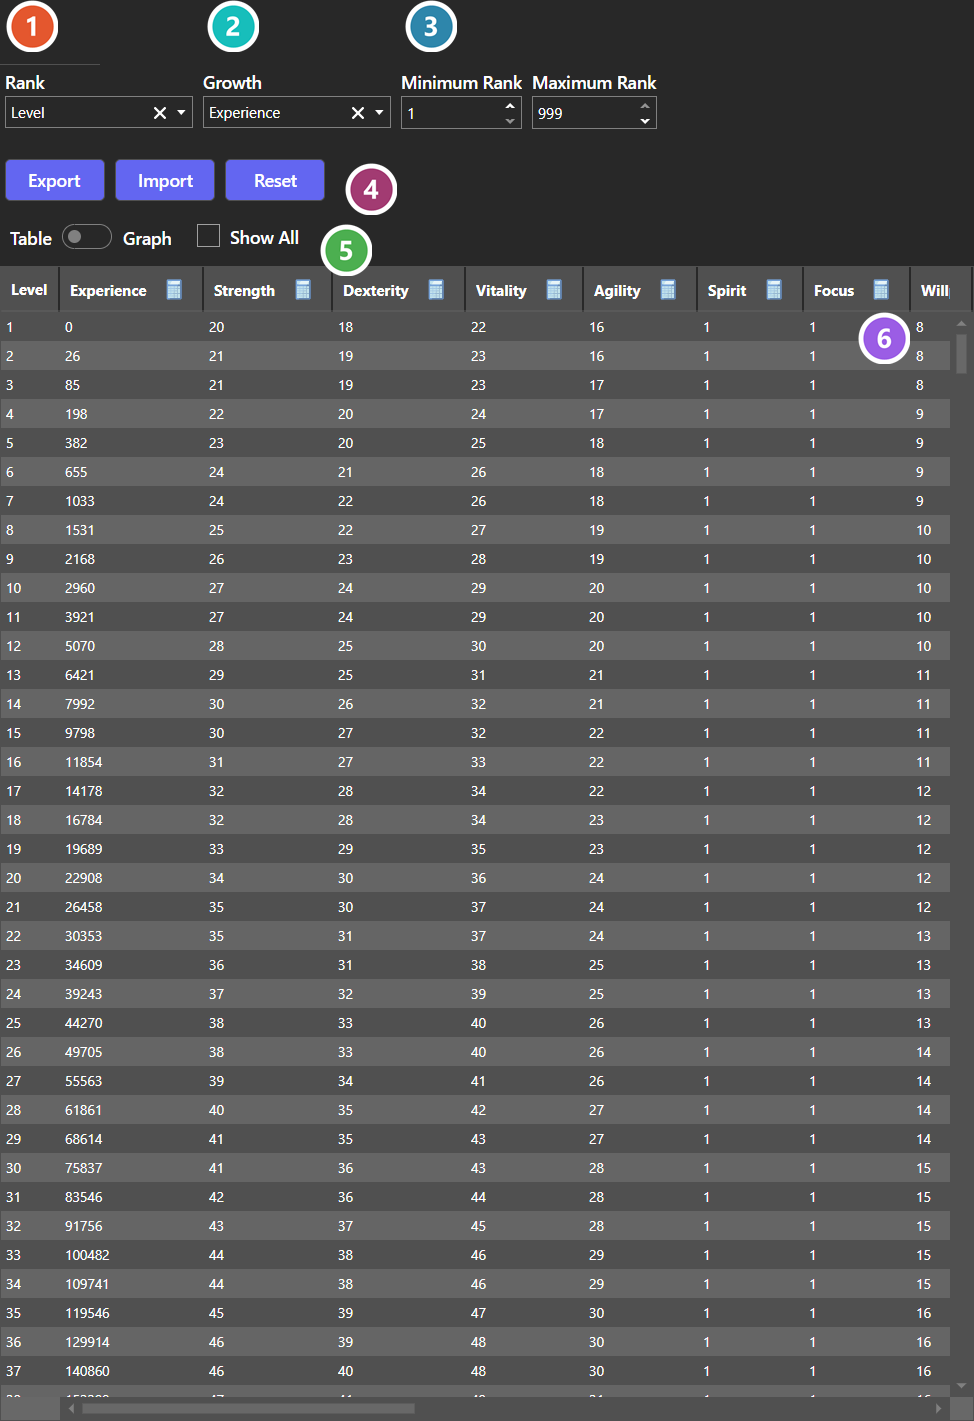
 Rank Statistic
The statistic that tracks the current rank — the column the table is keyed on.
 Growth Statistic
The statistic that accumulates toward the next rank. In a level-based setup this is experience.
 Rank Range
The lowest and highest rank the table covers. Widening the range adds rows; narrowing it drops them.
 Export / Import / Reset
Moves the whole table in and out of a file. Tables this large are usually easier to author in a spreadsheet and import back.
 Table / Graph
Switches between editing the raw numbers and seeing them plotted, which makes an uneven growth curve obvious at a glance.
 Values
One row per rank and one column per statistic in Table mode; one editable curve per statistic in Graph mode. The calculator opens a Formula editor from a column header in Table mode, and a Curve editor from a card in Graph mode. In Graph mode a point on a curve can also be clicked to set that rank's value directly.
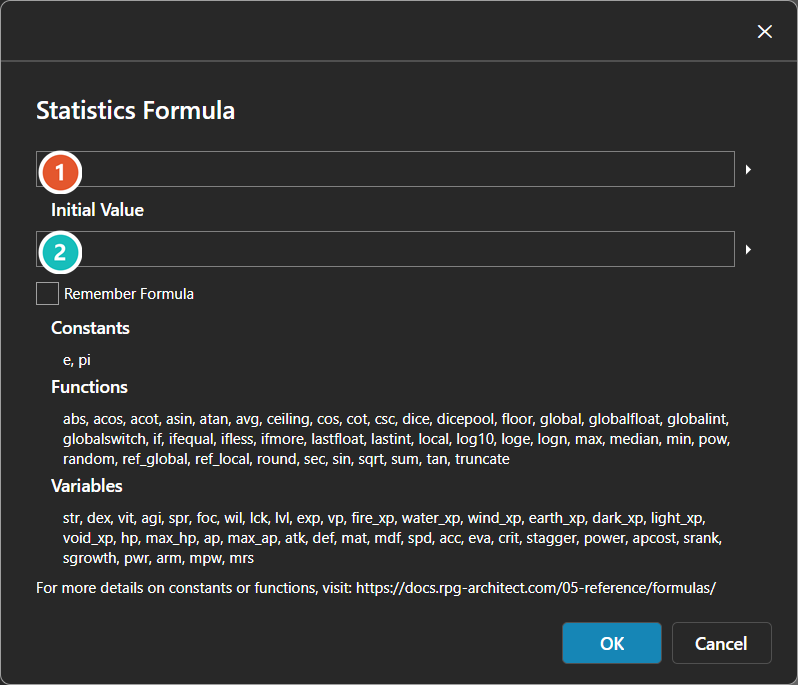
Formula
The expression evaluated for every rank in the column, written in the engine's own formula syntax. The names listed under Variables below are the other statistics, so one column can be derived from another.
Initial Value
The value the first rank starts from, where the formula needs somewhere to begin. Both boxes expand into a larger editor with the arrow at their right.
Graph Mode
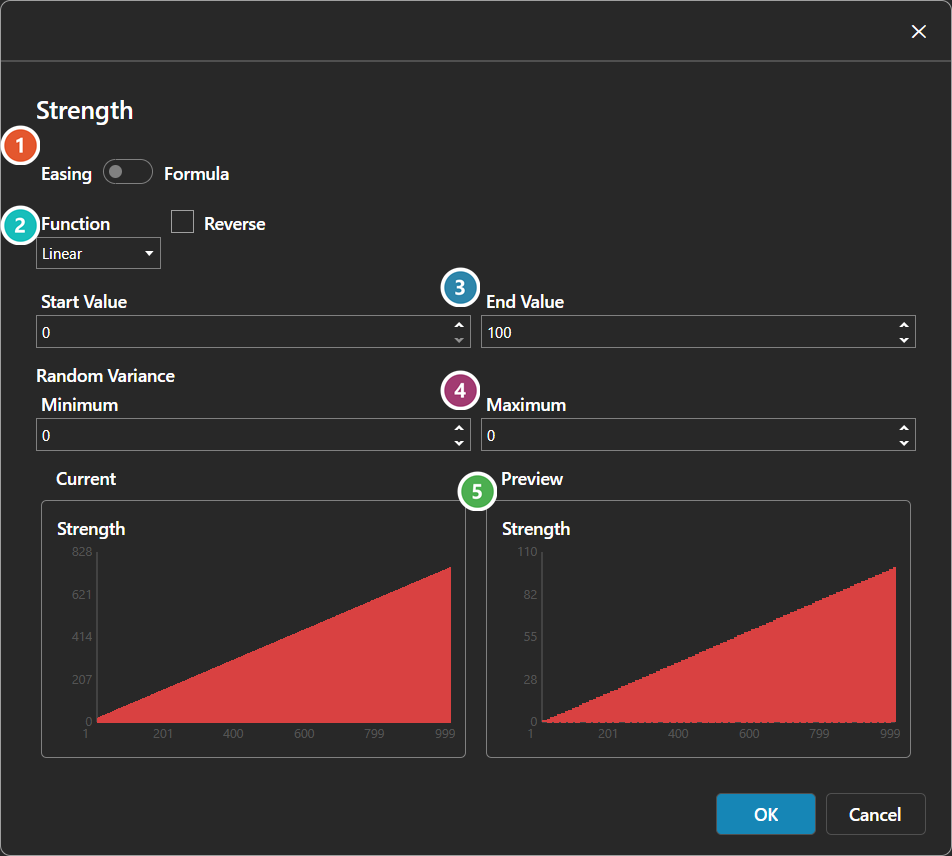
Easing / Formula
How the curve is generated — stepped through an easing function, or evaluated from a formula.
Easing Function
Which easing function shapes the curve, and whether it runs in reverse. See Easing Function Editor.
Start / End Values
The range the curve spans — the value at the first rank and the value at the last.
Random Variance
How far each rank's value may drift from the curve, so growth need not be perfectly smooth.
Current / Preview
The values the table holds now, beside the ones these settings would produce.